How Vynix Captures Console and Network Detail
A bug report that says "the checkout button is broken" is not enough for a developer to start fixing the problem. Vynix adds a lightweight widget to your site so anyone can click the broken part and capture the context developers usually have to ask for later.

Why console and network context matters
Most website bugs are not visible in the screenshot alone. A button may look normal but fail because a JavaScript error stopped the click handler. A product page may be blank because an API request returned 500. A form may submit twice because the browser retried a request after a timeout. Without console and network detail, the person fixing the issue has to recreate the exact state of the page and hope the same failure happens again.
This is where many bug reports lose time. A product manager, QA tester, support agent, or customer success teammate sees the problem and files a note. A developer reads it later and asks for the URL, browser, steps, console output, request payload, response code, and whether the issue happens in production or staging. That back-and-forth can take longer than the fix.
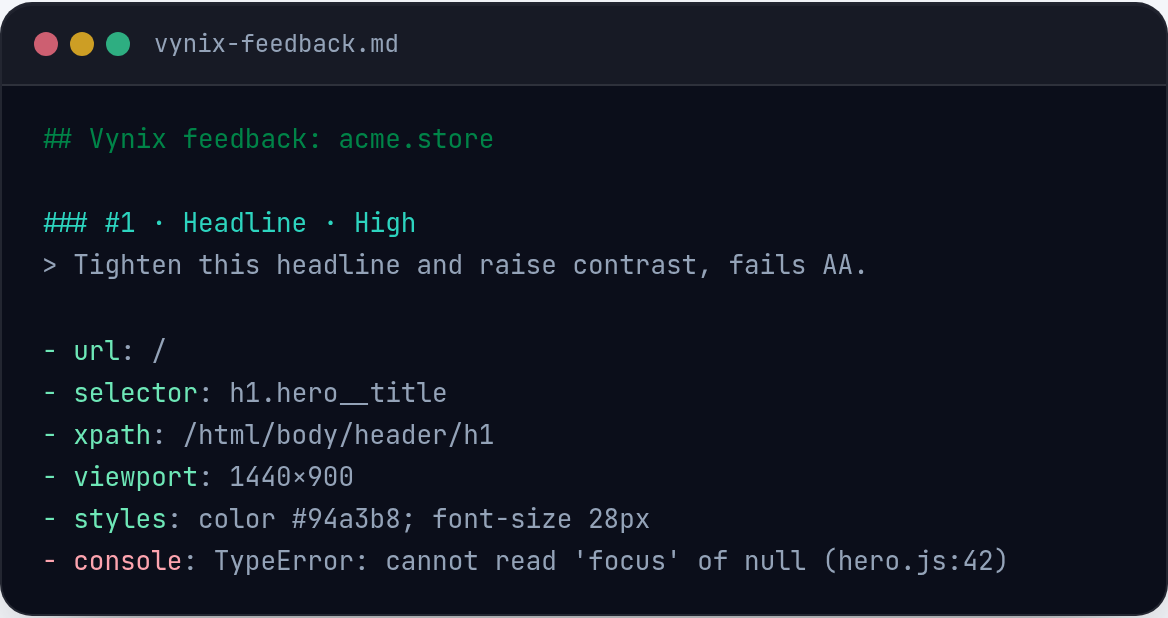
Vynix is built to shorten that loop. When someone clicks what is wrong on the page, Vynix captures the selected element, a screenshot, console and network context, and an AI diagnosis of the likely root cause. The result is not just a complaint. It is a bug report with the clues a developer needs to start investigating.
What happens when someone clicks the broken element
The important detail is that Vynix starts from the page itself, not from a blank form. The user does not need to describe the CSS selector, inspect the DOM, open DevTools, or copy logs by hand. They point to the part of the interface that looks wrong or behaves wrong, then Vynix packages the surrounding technical context.
That click gives the report an anchor. If a badge is misaligned, the report is tied to that badge. If a modal will not close, the report is tied to the close button or the modal container. If a price is missing, the report is tied to the affected area instead of a general note like "pricing bug on page." This helps developers connect the visual problem with the underlying code path.
The captured context can include several useful pieces:
- The page element that was clicked, so the issue is tied to a specific part of the UI.
- A screenshot, so the developer can see what the reporter saw.
- Console context, which can point to JavaScript errors, warnings, or failed runtime assumptions.
- Network context, which can reveal failed requests, unexpected status codes, or API calls linked to the issue.
- An AI diagnosis that summarizes the likely root cause and gives the developer a starting point.
- A ready-to-build prompt or a GitHub issue that can be assigned to a coding agent.
How console detail changes the report
The browser console is often the first place a developer looks when a page misbehaves. It can show uncaught exceptions, failed script loads, blocked resources, deprecation warnings, and messages added by the application. These details matter because a visible bug is often the last symptom, not the first cause.
For example, imagine a settings page where the "Save" button does nothing. A screenshot shows a normal-looking page. A written report might say, "Clicking Save does not work." With console context, the report may show that clicking the button triggers an error such as a missing property on the user object or a function that was not loaded. That turns the issue from "please investigate" into "check why this value is undefined in this state."
Console context is also useful when the UI looks broken but the root cause is a client-side rendering problem. A component may fail after receiving data in a shape it did not expect. A feature flag may hide a dependency. A script may throw before later code runs. Vynix helps keep those clues attached to the report, instead of depending on the reporter to know how to open DevTools and copy the right lines.
- Developers can see whether an error happened near the time of the report.
- A copied issue can include runtime clues that are hard to reproduce later.
- The AI diagnosis has better input because it can consider the clicked element, screenshot, and console context together.
How network detail helps explain broken states
Many frontend bugs are really data or request bugs. The page may render correctly when an API responds as expected, then fall apart when the response is slow, empty, rejected, or shaped differently than the frontend expects. Network context helps developers see what the browser was trying to load around the time the issue was reported.
A common example is a dashboard card that stays in a loading state. Without network detail, the report is vague: "Revenue card spins forever." With network context, a developer can check whether the request failed, returned an unauthorized response, timed out, or came back with missing fields. If the API returned a 401, the likely fix may be in auth handling. If it returned 200 with an empty array, the issue may be in empty-state rendering. If it returned 500, the backend or gateway may need attention.
Network context also helps when a page is partially broken. A search page may load filters but not results. A profile page may load the avatar but not permissions. A checkout page may load shipping methods but fail to calculate tax. Seeing the related requests makes it easier to decide where to look first, instead of treating the whole page as one unknown failure.
- Failed or unexpected API requests can be linked to the visible UI problem.
- Status codes can narrow the investigation to auth, validation, server errors, or missing resources.
- Request timing and order can help explain loading states, race conditions, and partial renders.
- The report can preserve details that might disappear after a refresh or a retry.
From captured context to a buildable task
Capturing detail is only useful if it turns into something a developer can act on. Vynix connects the report to the next step: you can copy a ready-to-build prompt or open a GitHub issue and assign it to a coding agent. That matters because a good agent task needs context, not just an instruction like "fix the page."
A useful coding prompt should identify the affected UI, describe the visible behavior, include technical clues, and suggest where to start. Vynix has the raw material for that because it collects the clicked element, screenshot, console and network context, and AI diagnosis. The developer or agent can then work from a richer brief.
For example, a weak task says, "Fix broken checkout." A stronger task says, "On the checkout page, clicking the Apply Coupon button does not update the order total. The captured console context shows a client-side error after the click. The network context shows the coupon validation request returning successfully, so start by checking the frontend handler that applies the response to the order summary." That second version is much easier to build from, review, and test.
Using captured detail responsibly
Console and network context can be very helpful, but teams should still treat bug reports as technical artifacts. Network requests and logs may contain data from the running application. Before sharing an issue broadly, review the captured information the same way you would review a pasted console log, API response, or screenshot.
The safest habit is to avoid putting secrets in frontend logs or client-visible responses in the first place. Tokens, passwords, private keys, and sensitive customer data should not be written to the console or exposed in browser-readable payloads unless the application genuinely needs that data on the client. Vynix helps capture what the browser can see, so the quality of your application hygiene still matters.
It also helps to keep reports focused. Click the element that is actually wrong, add a short human note about what you expected, and send the captured context with the task. The combination of human judgment and browser context gives developers a clearer path than either one alone.
- Do not rely on screenshots alone for interactive or data-driven bugs.
- Do not ask non-developers to manually copy DevTools output if Vynix can capture the context for them.
- Do review captured reports when they may include sensitive application data.
- Do add a short note about expected behavior, because context explains what happened, not always what should have happened.
- Vynix turns a click on a broken part of a website into a report with element, screenshot, console, network, and AI diagnosis context.
- Console and network detail help developers separate visible symptoms from likely causes, such as JavaScript errors, failed API calls, auth problems, or partial data loading.
- The captured context can become a ready-to-build prompt or GitHub issue, which makes bug reports easier for developers and coding agents to act on.
Frequently asked questions
Does Vynix replace browser DevTools?
No. Developers may still use DevTools to debug deeply. Vynix helps capture the first layer of context at the moment someone sees a bug, so the developer starts with the clicked element, screenshot, console context, network context, and likely root cause instead of a vague report.
Can non-developers use Vynix to report technical bugs?
Yes. The point of the widget is that a reporter can click what is wrong on the site without opening DevTools or understanding the DOM. Vynix captures the technical context and turns it into a report developers can use.
What can I do with the report after Vynix captures it?
You can copy a ready-to-build prompt or open a GitHub issue and assign it to a coding agent. That lets the captured element, screenshot, console and network details, and AI diagnosis move directly into the development workflow.
Install the widget with one script tag, point at a bug, and hand the fix to your coding agent.
Get started free